|
Deep Sequencing/Sequencing by Synthesis-
Deep sequencing is a technique in which a DNA string is split into
fragments of 200 to 300 basepairs. These fragments are then attached
to a solid surface and on this surface amplified (solid state PCR).
Afterward, for each of these clusters, 36 basepairs are
sequenced by synthesizing the second strand. This process typically
leads to around 60'000'000 short fragment reads. Here we
aggregated a number of notes that might be valuable for users of
an Illumina GA2 machine.
|
|
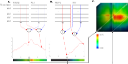
Highly Detailed Cross Correlation Analysis of Genomic Signal Tracks-
This technique allows the finding of relations between multiple deep
sequencing genomic signal tracks. The method finds relations between
peaks/peaks, peaks/areas and areas/areas over short and/or long distances.
Using this method we revisit previously published
acetylation and methylation patterns and present around 1760 maps, one for each
combination of histone modifications. The resulting correlation maps are
browsable and reveal a variety of highly interesting colocations.
|

|
Mass
Spectrometry Denoising-
MALDI-TOF mass spectrometry is a well known and widely used technique
to fingerprint and sequence proteins. A careful investigation of the
mass spectra output from unnamed machines shows a number of artifacts
produced by the machines themselves. Because these artifacts
complicate a number of procedures we created a wavelet based denoising
technique. |

|
 2DE Gel Correlation Analysis -
Two-dimensional gel electrophoresis (2DE) is a powerful technique to
examine post-translational modifications of complexly modulated
proteins. Currently, spot detection is a necessary step to assess
relations between spots and biological variables. This often proves
time consuming and difficult when working with non-perfect gels. We
developed an analysis technique to measure correlation between 2DE
images and biological variables on a pixel by pixel basis. After image
alignment and normalization, the biological parameters and pixel
values are replaced by their specific rank. These rank adjusted images
and parameters are then put into a standard linear Pearson correlation
and further tested for significance and variance.
2DE Gel Correlation Analysis -
Two-dimensional gel electrophoresis (2DE) is a powerful technique to
examine post-translational modifications of complexly modulated
proteins. Currently, spot detection is a necessary step to assess
relations between spots and biological variables. This often proves
time consuming and difficult when working with non-perfect gels. We
developed an analysis technique to measure correlation between 2DE
images and biological variables on a pixel by pixel basis. After image
alignment and normalization, the biological parameters and pixel
values are replaced by their specific rank. These rank adjusted images
and parameters are then put into a standard linear Pearson correlation
and further tested for significance and variance.
|
|
2DE Gel Denoising - when working with 2D
electrophoretic gels, the photographed images often have all kinds of
artifacts in them. Such gels are often regarded as 'bad' and while it
may be true that they can be better, in practice the necessary
information might still be present. By using
specific denoising techniques it is possible to retrieve this
information, thereby removing many of the unwanted effects
|
|
2DE Gel Image Registration /
Overlaying - before analysis is possible, image alignment (also
called registration) is often necessary. We provide techniques to
overlay multiple gels, which can lead to automatic protein isoform
detection.
|
 |
Micro Array
Analysis - To
perform a quantitative analysis with gene-arrays, one must take into
account inaccuracies (experimental variations, biological variations
and other measurement errors) which are seldomly known. For each micro
array analysis we investigated amplification and noise propagation related errors by
measuring intensity dependent variations. Based on a set of control
samples, we create confidence intervals on up and down regulations.
|
 |
Screening Normalization -
Surprisingly enough, the techniques developed for Micro-array
normalization are suitable as well in the context of siRNA screening.
The main difference is that instead of measuring the effect 1 siRNA
has on a cell system, a reporter system will measure the effect
different siRNA's has on the same reporter system.
|
|
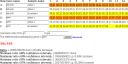
Real Time PCR / qPCR Analysis -
A calculator we developed. It takes as input the exported CT values of a Roche
LightCycler and calculates the up and down-regulation of genes between
two samples suing the ΔΔCT method. In short this method
first calculates the normalized CT time for each sample (by
subtracting the gene CT time from the reference gene CT time).
Afterward these two ΔCT values are compared by subtracting the
ΔCT of the altered sample from the ΔCT value from the non
altered sample. The result is the log2 ratio of the up or down
regulation. This value is then transformed to the actual regulation
using 2^-(ΔΔCT) and reported accordingly.
|
|
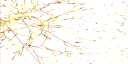
Assessment of related proteins - By means
of a protein interaction map we are able to deduce which proteins are
very likely influenced by a specific cell system alteration. See the
work done on MK5. A full description is available
here
|
|
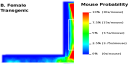
Tracking Mice on
an Elevated Maze - To observe the difference in behavior
between transgenic and non transgenic mice, standard behavioral tests
exists. Two of these tests are the elevated maze and the light dark
box. We developed a novel technique to assess the presence of each
mouse throughout each test.
|