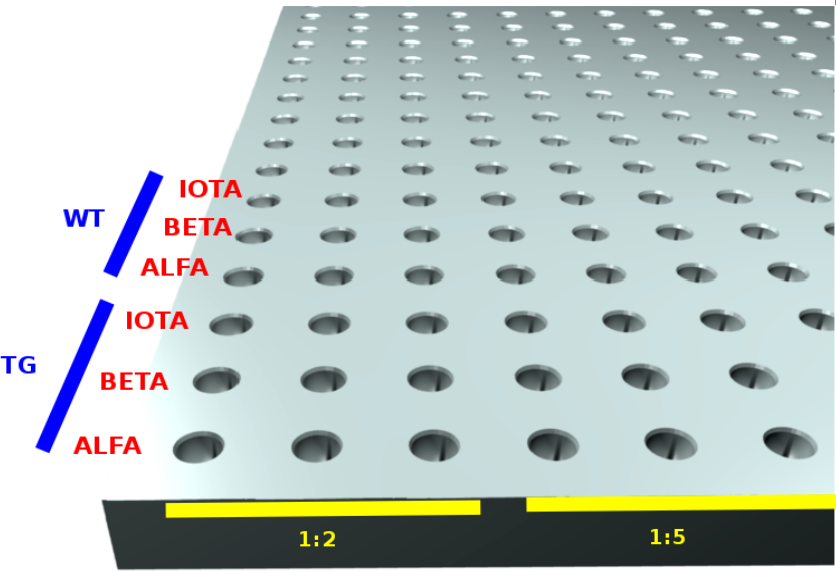
Up/down regulations
| Household |
Gene |
From |
To |
Direction |
Ratio |
Log(ratio) |
| GADPH |
TPM4 |
siRNA |
Normal |
Up |
1.37929 |
0.463925 |
| GADPH |
TAF9 |
siRNA |
Normal |
Down |
3.54528 |
-1.8259 |
| GADPH |
TAF1B |
siRNA |
Normal |
Up |
1.72315 |
0.78505 |
| GADPH |
TAF15 |
siRNA |
Normal |
Up |
3.97223 |
1.98995 |
| GADPH |
NRG1 |
siRNA |
Normal |
Up |
9.31496 |
3.21955 |
| GADPH |
MBTPS2 |
siRNA |
Normal |
Up |
2.44575 |
1.29028 |
| GADPH |
HIF1A |
siRNA |
Normal |
Down |
1.35973 |
-0.443325 |
| GADPH |
BCHE |
siRNA |
Normal |
Down |
1.20226 |
-0.26575 |
| BCHE |
TPM4 |
siRNA |
Normal |
Up |
1.65827 |
0.729675 |
| BCHE |
TAF9 |
siRNA |
Normal |
Down |
2.94885 |
-1.56015 |
| BCHE |
TAF1B |
siRNA |
Normal |
Up |
2.07168 |
1.0508 |
| BCHE |
TAF15 |
siRNA |
Normal |
Up |
4.77566 |
2.2557 |
| BCHE |
NRG1 |
siRNA |
Normal |
Up |
11.199 |
3.4853 |
| BCHE |
MBTPS2 |
siRNA |
Normal |
Up |
2.94043 |
1.55602 |
| BCHE |
HIF1A |
siRNA |
Normal |
Down |
1.13098 |
-0.177575 |
| BCHE |
GADPH |
siRNA |
Normal |
Up |
1.20226 |
0.26575 |
|
Efficiencies
| Cell |
Gene |
Average Efficiency |
Comment |
| Normal |
BCHE |
105.841 |
Accepted group |
| Normal |
FOS |
170.712 |
Rejected group |
| Normal |
GABARAP |
121.973 |
Rejected group |
| Normal |
GADPH |
91.5267 |
Accepted group |
| Normal |
GTF2B |
133.654 |
Rejected group |
| Normal |
HIF1A |
92.6202 |
Accepted group |
| Normal |
LZIC |
nan |
Rejected group |
| Normal |
MBTPS2 |
95.3834 |
Accepted group |
| siRNA |
BCHE |
111.697 |
Accepted group |
| siRNA |
FOS |
191.324 |
Rejected group |
| siRNA |
GABARAP |
146.561 |
Rejected group |
| siRNA |
GADPH |
97.6546 |
Accepted group |
| ... |
...
|
... |
... |
| siRNA |
MBTPS2 |
93.8257 |
Accepted group |
| siRNA |
NEFH |
326.86 |
Rejected group |
| siRNA |
NMU |
70.5202 |
Rejected group |
| siRNA |
NRG1 |
97.0566 |
Accepted group |
| siRNA |
TAF15 |
110.147 |
Accepted group |
| siRNA |
TAF1B |
89.7493 |
Accepted group |
| siRNA |
TAF6 |
129.888 |
Rejected group |
| siRNA |
TAF9 |
97.1325 |
Accepted group |
| siRNA |
TPM4 |
111.765 |
Accepted group |
|
