File Formats
This page describes the fileformats as used in the Illumina genome
analyzer.
Intensity files
These are the files that can be found in the directory
s_#lane_#tile_nse.txt
These files are generated during the cluster detection and are tab seperated.
The content of the file is not well documented but it seems to cover the variance within each cluster.
                         cycle 1                         cycle 2                          cycle 3
lane tile  x      y      a      c      g      t          a       c       g      t         a      c       g      t     ...
2    47    219    303    9.9    9.9    4.9    4.6        15.0    16.9    6.0    8.8       14.9   17.7    7.8    7.8   ...
s_#lane_#tile_int.txt
The intensity files contain the average intensity for each cluster on each of the 4 images. Below is an example. These
intensities are non-normalized. So crosstalk is still present.
                        cycle 1                         cycle 2                          cycle 3
lane  tile  x    y      a      c     g       t          a       c      g      t         a      c       g      t     ...
2     47    219  303    64.8   69.4  1567.9  525.7      790.7  597.9   45.8   32.2      178.1  630.8   46.1   29.6
Base called files
s_#lane_#tile_sig2.txt
These are the files afte crosstalk correction has been performed. If interested in the intensities this is the file that should be used. Its format is again tab seperated. One row per cluster.
                        cycle 1                         cycle 2                          cycle 3
lane  tile  x    y      a      c     g       t          a       c     g      t         a      c       g      t     ...
2     47    219  303    -6.5   3.5 1056.5  -24.7      661.4   12.7   17.1   13.9      -23.2  679.4   17.6   10.2
s_#lane_#tile_seq.txt
The sequence file that will list for each cluster the bases that have been called. If a base could not be called a '.' is used.
lane    tile    x       y       sequence
2       47      219     303     GACATTATGGGTCTGCAAGCTGCTTATGCTAATTTG
2       47      223     1924    GGTGTGGTTGATATTTTTCATGGTATTGATAAAGCT
2       47      621     348     GGAAGTAGCGACAGCTTGGTTTTTAGTGAGTTGTTC
2       47      892     162     GCTTCCATAAGCAGATGGATAACCGCATCAAGCTCT
2       47      1473    657     GCTTTATCAAGATAATTTTTCGACTCATCAGAAATA
2       47      670     345     GTCAATCCTGACGGTTATTTCCTAGACAAATTAGAG
2       47      1787    755     G...................................
s_#lane_#tile_prb.txt
The probability file contains for each cluster the probabilities that
the specific bases were called properly ? The file format is explained
in detail
here.
Each line corresponds to the cluster found at the same line in the _seq, _sig2, _int and _qhg files.
The tabs are at unexpected places: between each cycle and not between each number. The numbers are simply seperated by spaces.
  cycle 1                 cycle 2                cycle 3                  cycle 4
  a    c    g    t        a    c    g    t        a    c    g    t         a    c    g    t     ...
 -40  -40   40  -40       40  -40  -40  -40      -40   40  -40  -40       40  -40  -40  -40     ...
s_#lane_#tile_qhg.txt
The quality metrics that can afterwards be used for filtering the data
Lane; tile; xPos; yPos; chastity, purity;
similarity; neighbour; neighbourhood
Lane    Tile    x       y     chastity  purity  similarity  neighbour  neighbourhood
2       47      219     303   0.67      0.82    -0.43       3.00       70696:30892:61591:23697:37453:32059:85214:54989
Eland aligned files
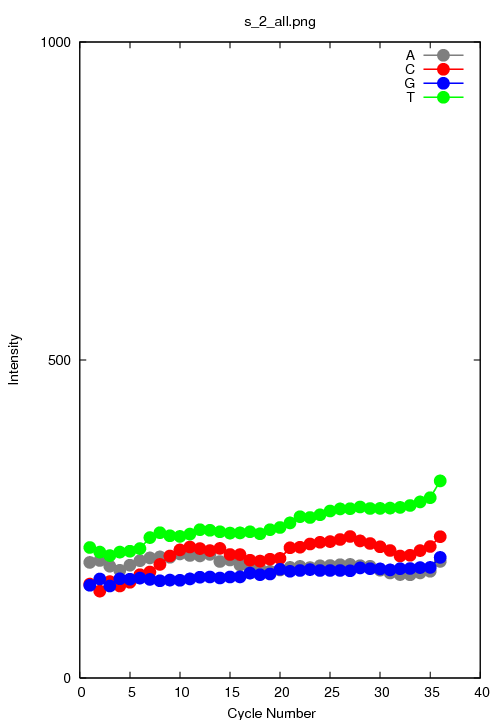
s_#lane_#tile_all.png
This is a file that reports the average intensity over each of the
called bases for the specified tile and lane.
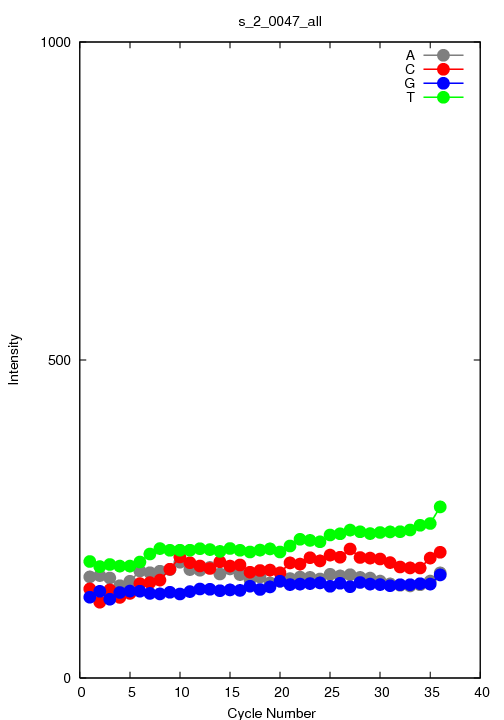
s_#lane_#tile_all.txt
Contains the statistics that are used to generate the various plots.
# Clusters: Filtered 63791 Original 100455
#
#Lane   Cycle   All A   All C   All G   All T   Call A  Call C  Call G Call T  Num A   Num C   Num G   Num T   Num X
2       1       158.5   141.9   127.0   183.2   575.7   546.2   595.1  585.7   17055   14516   13525   18695   0
2       2       160.5   120.8   136.4   174.8   546.8   525.8   575.1  550.7   17442   12941   14551   18857   0
2       3       156.6   140.7   123.8   178.3   549.2   534.6   558.3  548.7   17000   14412   13514   18865   0
2       4       144.6   128.2   134.5   175.6   516.9   500.6   553.2  535.4   16491   14249   14553   18498   0
2       5       151.2   134.7   137.0   175.8   518.1   522.6   550.4  528.2   17284   12970   14755   18782   0
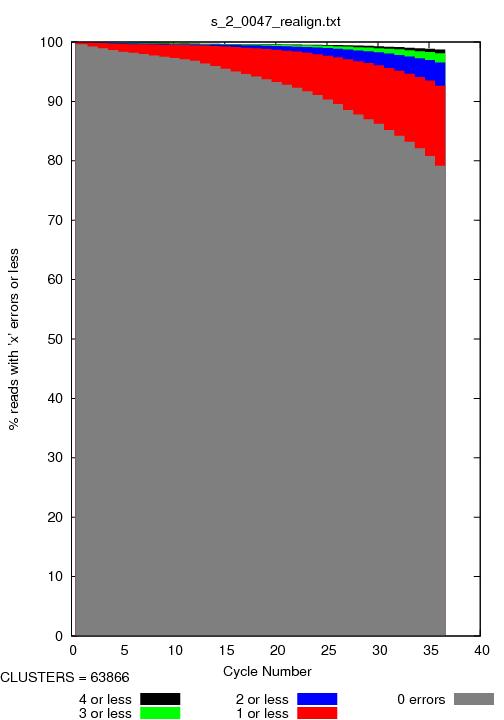
s_#lane_#tile_errors.png
This image reports the number of sequences that could be directyle/one mismatch/two mismatches be aligned after x cycles. Below is an example.
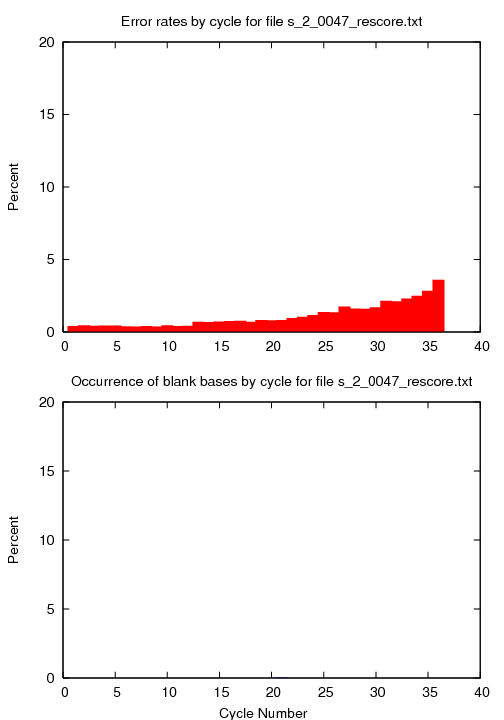
s_#lane_#tile_rescore.png
This image reports the percentage of errors per position in the alginment.
Below is an example.
s_#lane_#tile_rescore.txt
This is actually an interesting file that reports on the filtering of the data. It contains multiple sections. Below is a demonstration of such a file shortened somewhat by removing cycles 2-35.
#RUN_TIME Thu Jun 26 20:47:35 2008
#SOFTWARE_VERSION @(#) $Id: score.pl,v 1.2 2008-05-30 07:36:06 wernersa Exp $
# Lane 2 : Tile 47 : Quality Filtered
2233116 bases of sequence found
16279 were errors
20 were blanks
 0.73 percent error rate
 0.00 percent blank rate

unique alignments : 62031 (total score 3937852)
cycles : 36

Breakdown of errors by cycle
Cycle:	Err pc:	Blank pc:
1	 0.19	 0.00
36	 3.14	 0.00

Error rate relative to reference base (including blanks)
(Given a reference base, what is it sequenced as?)

Really:	Read as:
	N pc	A pc	C pc	G pc	T pc
A	 0.00	99.46	 0.28	 0.12	 0.14
C	 0.00	 0.21	99.41	 0.03	 0.35
G	 0.00	 0.24	 0.13	98.37	 1.26
T	 0.00	 0.04	 0.15	 0.10	99.70

Error rate relative to reference base (excluding blanks)
(Given a reference base, what is it sequenced as?)

Really:	Read as:
	A pc	C pc	G pc	T pc
A	99.46	 0.28	 0.12	 0.14
C	 0.21	99.41	 0.03	 0.35
G	 0.24	 0.13	98.37	 1.26
T	 0.04	 0.15	 0.10	99.70

Error rate relative to sequenced base
(Given a sequenced base, what was it really?)

Read as:	Really:
	A pc	C pc	G pc	T pc
N	30.00	25.00	10.00	35.00
A	99.57	 0.18	 0.21	 0.05
C	 0.33	99.33	 0.13	 0.20
G	 0.14	 0.03	99.69	 0.14
T	 0.13	 0.26	 0.95	98.66

Breakdown of errors by nucleotide

Read As:	Really:
	A pc	C pc	G pc	T pc
N	6	5	2	7
A	581763	1042	1200	266
C	1650	494665	656	1011
G	683	165	489812	680
T	844	1744	6258	650577

Full breakdown of errors by cycle and nucleotide
Cycle:	Read As:	Really:
		A ct	C ct	G ct	T ct
1	N	0	0	0	0
1	A	16515	18	23	0
1	C	4	14118	3	17
1	G	12	1	13100	10
1	T	4	18	5	18183
36	N	0	0	0	0
36	A	15764	51	41	25
36	C	171	13740	90	46
36	G	43	17	12627	40
36	T	125	142	1156	17922

Error rate relative to reference by cycle/nucleotide
Cycle:	Read As:	Really:
		A ct	C ct	G ct	T ct
@1	N	 0.000	 0.000	 0.000	 0.000
@1	A	 0.999	 0.001	 0.002	 0.000
@1	C	 0.000	 0.997	 0.000	 0.001
@1	G	 0.001	 0.000	 0.998	 0.001
@1	T	 0.000	 0.001	 0.000	 0.999
@36	N	 0.000	 0.000	 0.000	 0.000
@36	A	 0.979	 0.004	 0.003	 0.001
@36	C	 0.011	 0.985	 0.006	 0.003
@36	G	 0.003	 0.001	 0.908	 0.002
@36	T	 0.008	 0.010	 0.083	 0.994

Information Content By Cycle
	Bases this cycle		Bases so far
Cycle:	Equiv info:	Align:	Total:	Equiv info:	Align:	Total:
~1	61363.11	62031	63791	61363.11	62031	63791
~36	55349.21	62031	63791	2161274.97	2233096	2296454

The 20 most common words with 2 blanks or less:
Ranking	Occurrences	Words
1	21	GTTTGATGAATGCAATGCGACAGGCTCATGCTGATG TCTCATATTGGCGCTACTGCAAAGGATATTTCTAAT
2	20	CTTGCTATTGACTCTACTGTAGACATTTTTACTTTT
3	18	ACTGATGCTGCTTCTGGTGTGGTTGATATTTTTCAT AGAACGTTTTTTACCTTTAGACATTACATCACTCCT AGATGGATAACCGCATCAAGCTCTTGGAAGAGATTC
4	17	CGATTAGAGGCGTTTTATGATAATCCCAATGCTTTG
5	16	9 sequences
6	15	24 sequences
7	14	28 sequences
8	13	56 sequences
9	12	104 sequences
10	11	161 sequences
11	10	306 sequences
12	9	447 sequences
13	8	610 sequences
14	7	896 sequences
15	6	1246 sequences
16	5	1529 sequences
17	4	1677 sequences
18	3	1676 sequences
19	2	1730 sequences
20	1	10463 sequences

The 3 most common blank patterns (N=any nonblank character)
Ranking	Occurrences	Words
1	63769	NNNNNNNNNNNNNNNNNNNNNNNNNNNNNNNNNNNN
2	20	NNNNNNNNNNNNNNNNNNNN.NNNNNNNNNNNNNNN
3	1	NNNNNNNNNNNNNNNNNNNNNNNN.NNNNNNNNNNN NNNNNNNNNNNNNNNNNNNNNNNNNNNNNNNN.NNN

Log likelihood scores
Cycle:	Read As:	Really:
		A	C	G	T
>1	N	-47	-47	-47	-47
>1	A	260	-296	-285	-47
>1	C	-354	276	-367	-291
>1	G	-303	-411	275	-311
>1	T	-365	-300	-356	282
>36	N	-47	-47	-47	-47
>36	A	212	-249	-258	-280
>36	C	-190	165	-219	-248
>36	G	-246	-287	210	-250
>36	T	-218	-213	-119	110

Cumulative errors by cycle
Cycle:	1	2	3	4	5
!1	61916	62031	62031	62031	62031
!36	50087	58673	61221	61866	62010
s_#lane_#tile_score.txt
Various statistics of this tile and lane before quality filtering.
#RUN_TIME Thu Jun 26 20:47:35 2008
#SOFTWARE_VERSION @(#) $Id: score.pl,v 1.2 2008-05-30 07:36:06 wernersa Exp $
# Lane 2 : Tile 47 : Raw
2691216 bases of sequence found
33142 were errors
134 were blanks
 1.23 percent error rate
 0.00 percent blank rate

unique alignments : 74756 (total score 4168089)
cycles : 36

Breakdown of errors by cycle
Cycle:	Err pc:	Blank pc:
1	 0.50	 0.10
36	 4.25	 0.00

Error rate relative to reference base (including blanks)
(Given a reference base, what is it sequenced as?)

Really:	Read as:
	N pc	A pc	C pc	G pc	T pc
A	 0.01	98.95	 0.50	 0.20	 0.35
C	 0.01	 0.44	98.96	 0.11	 0.47
G	 0.00	 0.32	 0.34	97.74	 1.60
T	 0.01	 0.14	 0.34	 0.29	99.23

Error rate relative to reference base (excluding blanks)
(Given a reference base, what is it sequenced as?)

Really:	Read as:
	A pc	C pc	G pc	T pc
A	98.96	 0.50	 0.20	 0.35
C	 0.44	98.97	 0.11	 0.47
G	 0.32	 0.34	97.74	 1.60
T	 0.14	 0.34	 0.29	99.24

Error rate relative to sequenced base
(Given a sequenced base, what was it really?)

Read as:	Really:
	A pc	C pc	G pc	T pc
N	26.87	27.61	10.45	35.07
A	99.20	 0.38	 0.27	 0.15
C	 0.58	98.63	 0.34	 0.45
G	 0.23	 0.11	99.27	 0.38
T	 0.31	 0.36	 1.20	98.13

Breakdown of errors by nucleotide

Read As:	Really:
	A pc	C pc	G pc	T pc
N	36	37	14	47
A	697767	2655	1931	1076
C	3502	592725	2048	2675
G	1377	669	586074	2245
T	2461	2838	9576	781374

Full breakdown of errors by cycle and nucleotide
Cycle:	Read As:	Really:
		A ct	C ct	G ct	T ct
1	N	22	19	8	25
1	A	19825	88	40	13
1	C	14	16733	12	36
1	G	21	11	15886	61
1	T	24	41	10	21867
36	N	0	0	0	0
36	A	18785	109	77	53
36	C	284	16441	184	113
36	G	84	53	14815	78
36	T	315	245	1578	21507

Error rate relative to reference by cycle/nucleotide
Cycle:	Read As:	Really:
		A ct	C ct	G ct	T ct
@1	N	 0.001	 0.001	 0.001	 0.001
@1	A	 0.996	 0.005	 0.003	 0.001
@1	C	 0.001	 0.991	 0.001	 0.002
@1	G	 0.001	 0.001	 0.996	 0.003
@1	T	 0.001	 0.002	 0.001	 0.994
@36	N	 0.000	 0.000	 0.000	 0.000
@36	A	 0.965	 0.006	 0.005	 0.002
@36	C	 0.015	 0.976	 0.011	 0.005
@36	G	 0.004	 0.003	 0.890	 0.004
@36	T	 0.016	 0.015	 0.095	 0.989

Information Content By Cycle
	Bases this cycle		Bases so far
Cycle:	Equiv info:	Align:	Total:	Equiv info:	Align:	Total:
~1	72766.19	74682	100268	72766.19	74682	100268
~36	64041.84	74756	98558	2548406.67	2691082	3537981

The 22 most common words with 2 blanks or less:
Ranking	Occurrences	Words
1	22	TCTCATATTGGCGCTACTGCAAAGGATATTTCTAAT
2	21	GTTTGATGAATGCAATGCGACAGGCTCATGCTGATG
3	20	CTTGCTATTGACTCTACTGTAGACATTTTTACTTTT
4	19	AGAACGTTTTTTACCTTTAGACATTACATCACTCCT TGCTTTTGATGCCGACCCTAAATTTTTTGCCTGTTT
5	18	ACTGATGCTGCTTCTGGTGTGGTTGATATTTTTCAT AGATGGATAACCGCATCAAGCTCTTGGAAGAGATTC CGATTAGAGGCGTTTTATGATAATCCCAATGCTTTG GTATTCTGGCGTGAAGTCGCCGACTGAATGCCAGCA TGACTATTGACGTCCTTCCTCGTACGCCGGGCAATA
6	17	9 sequences
7	16	14 sequences
8	15	24 sequences
9	14	50 sequences
10	13	102 sequences
11	12	124 sequences
12	11	228 sequences
13	10	365 sequences
14	9	534 sequences
15	8	720 sequences
16	7	1002 sequences
17	6	1328 sequences
18	5	1531 sequences
19	4	1638 sequences
20	3	1502 sequences
21	2	1778 sequences
22	1	39095 sequences

The 30 most common blank patterns (N=any nonblank character)
Ranking	Occurrences	Words
1	97289	NNNNNNNNNNNNNNNNNNNNNNNNNNNNNNNNNNNN
2	1661	N...................................
3	173	N....NNNNNNNNNNNNNNNNNNNNNNNNNNNNNNN
4	134	N...NNNNNNNNNNNNNNNNNNNNNNNNNNNNNNNN
5	128	.NNNNNNNNNNNNNNNNNNNNNNNNNNNNNNNNNNN
6	79	N.....NNNNNNNNNN....NNNNNNNNNNNNNNNN
7	67	NN..................................
8	60	N.....NNNNNNNNNNN..NNNNNNNNNNNNNNNNN
9	58	....................................
10	49	N.....NNNNNNNNNN...NNNNNNNNNNNNNNNNN
11	46	N.......................NNNN......NN
12	43	N.......NNNNN.......NNNNNNNNNNN..NNN
13	36	N.....NNNNNNNNN.....NNNNNNNNNNNNNNNN
14	34	N........NNNN.........NNNNNNNN...NNN
15	30	N.........NN...........NNNNNN.....NN
16	27	N.......................NNNN......N.
17	26	NNNNNNNNNNNNNNNNNNNN.NNNNNNNNNNNNNNN
18	22	N..........N...........NNNNNN.....NN N.......NNNNN........NNNNNNNNN...NNN N.......NNNNN.......NNNNNNNNNNN.NNNN
19	19	N......NNNNNN.......NNNNNNNNNNN.NNNN NN.........................N........
20	18	N.....NNNNNNNNNNNN.NNNNNNNNNNNNNNNNN
21	17	N......NNNNNNNN.....NNNNNNNNNNNNNNNN
22	16	N........NNN...........NNNNNN....NNN N.......NNNNN.......NNNNNNNNNN...NNN NN.NNNNNNNNNNNNNNNNNNNNNNNNNNNNNNNNN
23	15	N.........................N.........
24	13	N........................NN......... N......................NNNNNN.....NN N.......NNNNN.........NNNNNNNN...NNN
25	12	N.......................NNNNN.....NN
26	11	N......NNNNNN.N.....NNNNNNNNNNN.NNNN N.....NNNNNNNNNNNNNNNNNNNNNNNNNNNNNN NN.....NNNNNNNN.......NNNNNNNNNNNNNN
27	10	N........................NNN........ NNN..NNNNNNNNNN..N...NNNNNNNNNNNNNNN
28	9	N........................NNN......N. N........NNN..........NNNNNNN....NNN N..NNNNNNNNNNNNNNNNNNNNNNNNNNNNNNNNN NNN.NNNNNNNNNNNNNNNN.NNNNNNNNNNNNNNN
29	5	N......NNNNNNNN.....NNNNNNNNNNN.NNNN NN........................NN........ NN.....NNNNNNNN.......NNNNNNNNN.NNNN NNN..NNNNNNNNNNNNN...NNNNNNNNNNNNNNN
30	4	NN.....NNNNNN..........NNNNNNNN.NNNN

Log likelihood scores
Cycle:	Read As:	Really:
		A	C	G	T
>1	N	-37	-46	-91	-29
>1	A	214	-235	-269	-318
>1	C	-307	243	-314	-266
>1	G	-288	-316	223	-241
>1	T	-296	-272	-334	246
>36	N	-47	-47	-47	-47
>36	A	189	-223	-239	-255
>36	C	-177	145	-196	-217
>36	G	-225	-245	183	-228
>36	T	-186	-198	-114	100

Cumulative errors by cycle
Cycle:	1	2	3	4	5
!1	74311	74756	74756	74756	74756
!36	54261	66703	72317	74193	74601
PhageAlign Output
The s_N_TTT_align.txt files contain the unfiltered first-pass
alignments for a give tile. The s_N_TTTT_prealign.txt contains a
recalibration of the aligned sequences, thereby taking into account
the errormodel created based on the alignments (_align.txt and
_score.txt). The file s_N_realign.txt consists of alignments in
s_N_TTT_prealign.txt that do pass the filter criteria.
Lane summaries
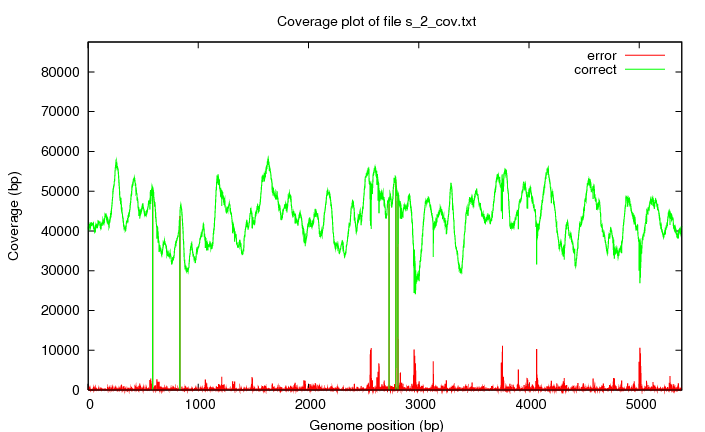
s_#lane_cov.png
The coverage of the bases compared to the genome.
s_2_all.png
The average intensity over all tiles.
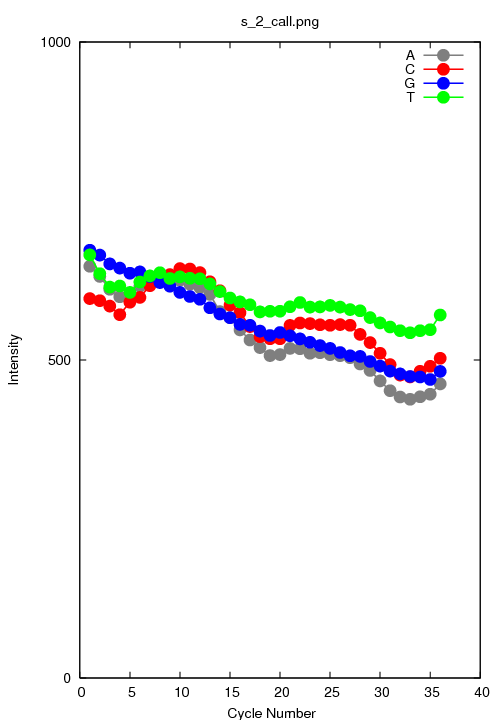
s_2_call.png
The average intensity of only the called bases.
s_2_calsaf.txt
s_2_eland_extended.txt
s_2_eland_multi.txt
s_2_eland_query.txt
s_#lane_export.txt
This file contains the following content
[1. Machine]
[2. Run number]
3. Lane
4. Tile
5. X coordinate cluster
6. Y coordinate cluster
[7. index string]
[8. Read number (1 or 2 for paired-end reads, blank for single
read analysis)]
9. Read
10. Quality string. The ASCII character code = quality value +64
11. Match chromosome - name of the chromosome match or code
indicating why no match resulted.
12. Match contig - gives the contig name if there is a match and
the match chromosome is split into contigs (blank if no match is found)
13. Match position - always with respect to forward strand,
numbering starts at 1 (blank if no match found)
14. Match strand - "F" for forward, "R" for reverse
15. Match descriptor. Consice description of alignment. A
numerical denotes a run of matchine bases. A letter denotes
substitution of a nucleotide. Eg. 32C2 denotes substitution of a C at
the 33rd position.
16. Single read alignment score - alignment scor of a single-read
match, or for a paired-read, alignment scoire of a read if it were
treated as a single read.
[17. paired-read alignment score]
[18. partner chromosome - name of the chromosome if the read is
paired and its partner aligns to another chromosome]
[19. Partner Contig]
[20. Partner Offset]
[21. Partner Strand]
22. Filtering. Did the read pass quality filtering. Y for yes, N
for no.
An example fragment of such a file.
HWI-EAS264	303KWAAXX	1	1	638	200			GTNNNTTTTCTGCTTAGNNGTTTAATCATGTTTCAA	NN???NNNNNNNNNNNN??NNNNNNNNNNNNNNNNN	QC											N
HWI-EAS264	303KWAAXX	1	1	1231	395			ACNNNCCAGAACGTGAANNAGCGTCCTGCGTGTAGC	PN???NNNNNNNNNNNN??NNNNNNNNNNNNNNNNN	QC											N
HWI-EAS264	303KWAAXX	1	1	1061	436			GTNNNCCGCATGACCTTNNCCATCTTGGCTTCCTTT	NN???NNNNNNNNNNNN??NNNNNNNNNNNNNNNNC	QC											N
HWI-EAS264	303KWAAXX	1	1	1076	412			GGNNNGTAGCGACAGCTNNGTTTTTAGTGAGTTGTT	NN???NNNNNNNNNNNN??NNNNNNNNNNNNNNNNN	QC											N
HWI-EAS264	303KWAAXX	1	1	1785	543			GNNNNNNNNNNNNNNNNNNNNNNNNNNNNNNNNNNN	N???????????????????????????????????	QC											N
HWI-EAS264	303KWAAXX	1	1	552	176			GGNNNGTTATAACGCCGNNGCGGTAATAAACTCAAT	NJ???NJNNNNNNJJNN??NNJNNNNBJNDDNBNEE	QC											N
HWI-EAS264	303KWAAXX	1	1	477	231			GTNNNGACAGCTTGGTTNNTAGTGAGTTTTTCCATT	PN???NNNNNNNNNNNN??NNNNJNJNNDNNNNNNN	QC											N
HWI-EAS264	303KWAAXX	1	1	1598	633			GANNNTTTGACGGTTAANNGTGGTAATGGTGGTTTT	PN???NNNNNNNNNNNN??HNNNNNNNNNNENENNN	QC											N
HWI-EAS264	303KWAAXX	1	1	653	186			GANNNTTTGCTATTCAGNNTTTGATGAATGCAATGC	PN???NNNNNNNNNNNN??NNNNNNNNNNNNNNNEN	QC											N
HWI-EAS264	303KWAAXX	1	1	1066	418			GCNNNATGTTTACTCTTNNGCTTGTTCGTTTTCCGC	NN???NNNNNNNNNNNN??NNNNJNNNNNNNNNNEN	QC											N
s_2_filt.txt
s_2_finished.txt
A file used by make to decide whether the process has finished or not.
s_2_frag.txt
s_2_percent_all.png
s_2_percent_base.png
s_2_percent_call.png
s_2_qcalreport.txt
s_2_qcal.txt
s_2_qraw.txt
s_2_qreport.txt
s_2_qtable.txt
s_2_saf.txt
s_2_score_files.txt
s_2_seqpre.txt
s_#lane_sequence.txt
Contains the sequences, quality scores and clusters after filtering. A
good strategy to filter out the sequences after filtering is grep
^[ACTG] <s_1_sequence.txt. The standard output is in fasq format
but with score+64 instead of score+32 to account for 'the dynamic
range', which doesn't make much sense anyway since a) nobody will
print these files; b) an extra 32 added will reduce the dynamic range
and since no scaling is reported this is probably nonsense.
@HWI-EAS264_303KWAAXX:4:1:978:308
GGTTGATATTTTTCATGGTATTGATAAAGCTGTTGC
+HWI-EAS264_303KWAAXX:4:1:978:308
]]]]]]]]]]]]]]]]][]]]][]]]][U][S[[P[
@HWI-EAS264_303KWAAXX:4:1:1246:245
GAAGTTAACACTTTCGGATATTTCTGATGAGTCGAA
+HWI-EAS264_303KWAAXX:4:1:1246:245
]]]]]]]]]]]]]]]][[]]]]][]U[][[[\\X\\
@HWI-EAS264_303KWAAXX:4:1:96:397
GTTCTGGTGATTCGTCTAAGAAGTTTAAGATTGCTG
+HWI-EAS264_303KWAAXX:4:1:96:397
]]]]]][]V]]]]V]]][[U[]V[]]]]R][[N[[M
s_2_Signal_Means.txt
s_2_sorted.txt
More Deep Sequencing notes
- http://analysis.yellowcouch.org/